Reporting
Users who belong to a group with reporting access can access the Reporting page from the main navigation menu.
On this page, a dropdown menu allows the user to select either:
- A specific process
- Or All processes
Once a selection is made, the reporting dashboard displays key insights:
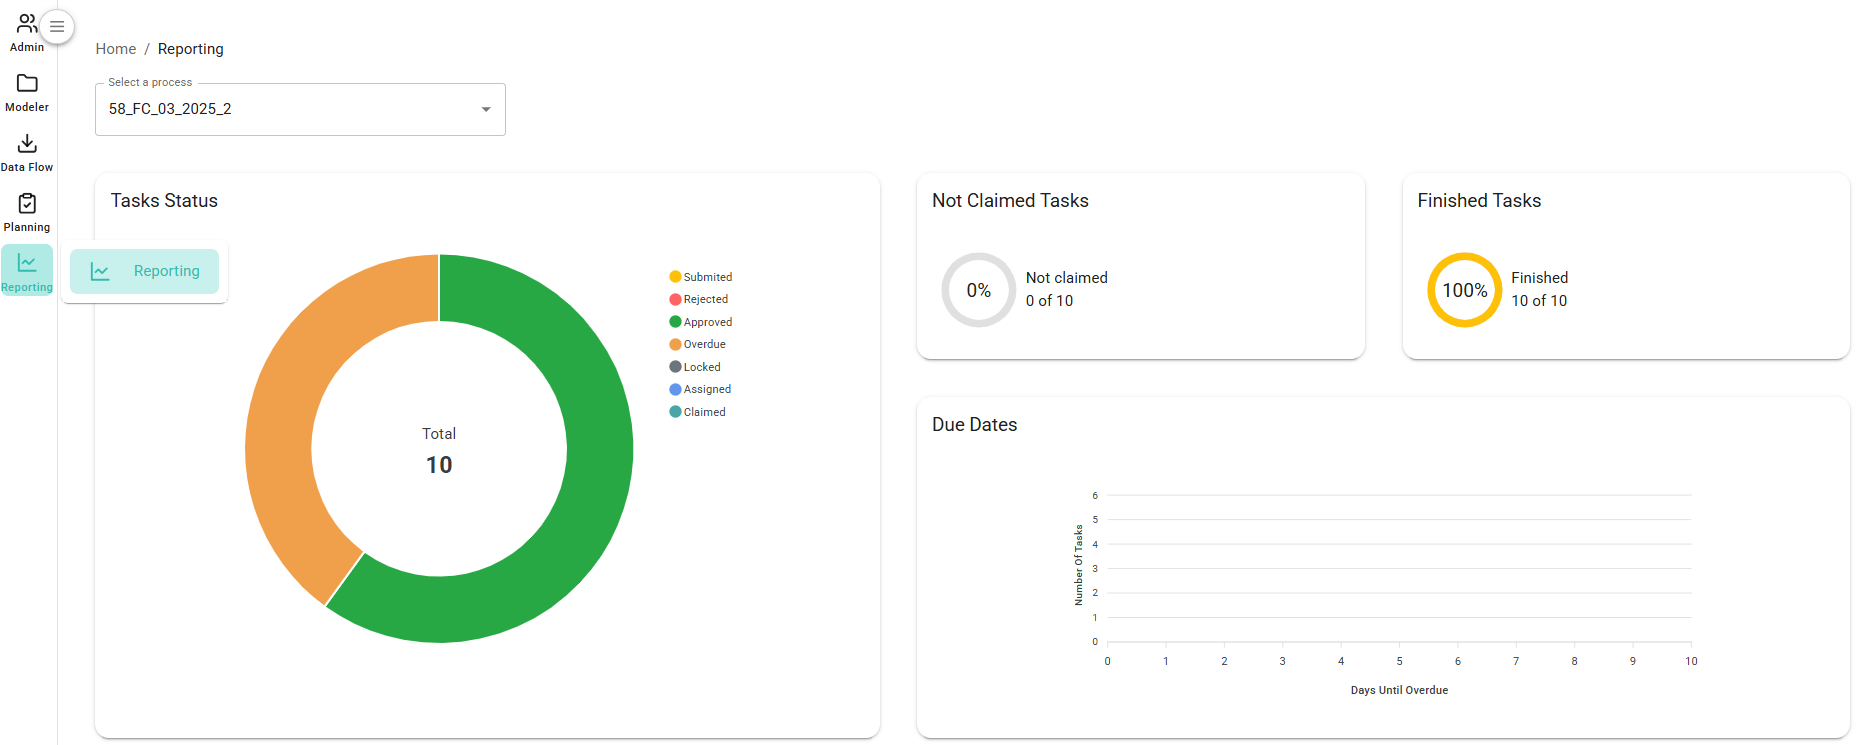
The dashboard includes:
- A pie chart showing the distribution of task statuses
- Percentage breakdown of Unclaimed and Finished tasks
- A timeline graph of task due dates
In addition to the visual data, a detailed table is shown listing all tasks, along with information such as assigned users, due dates, current status, and more:
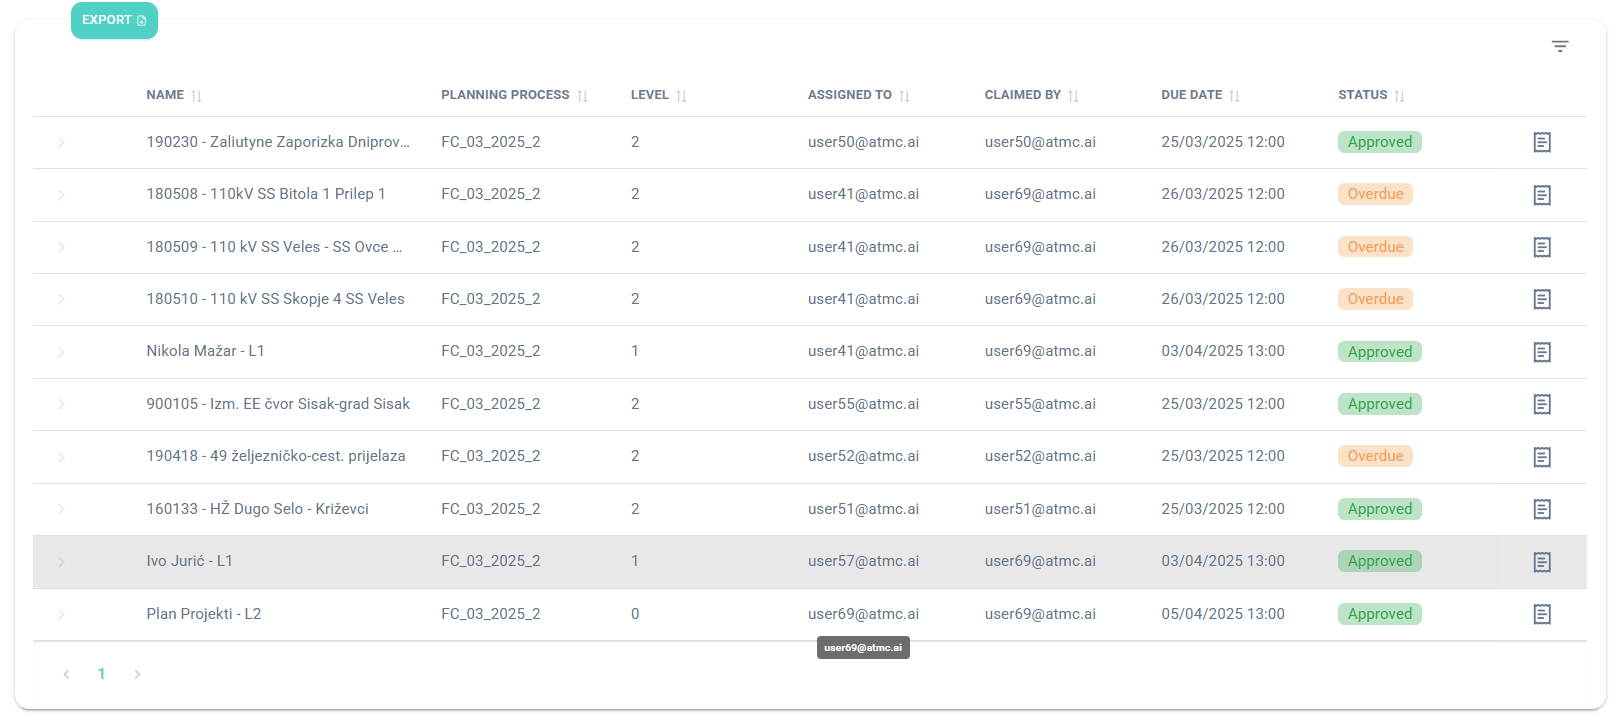
Each task in the list includes a Details button. Clicking it reveals a full history of actions performed on the task:
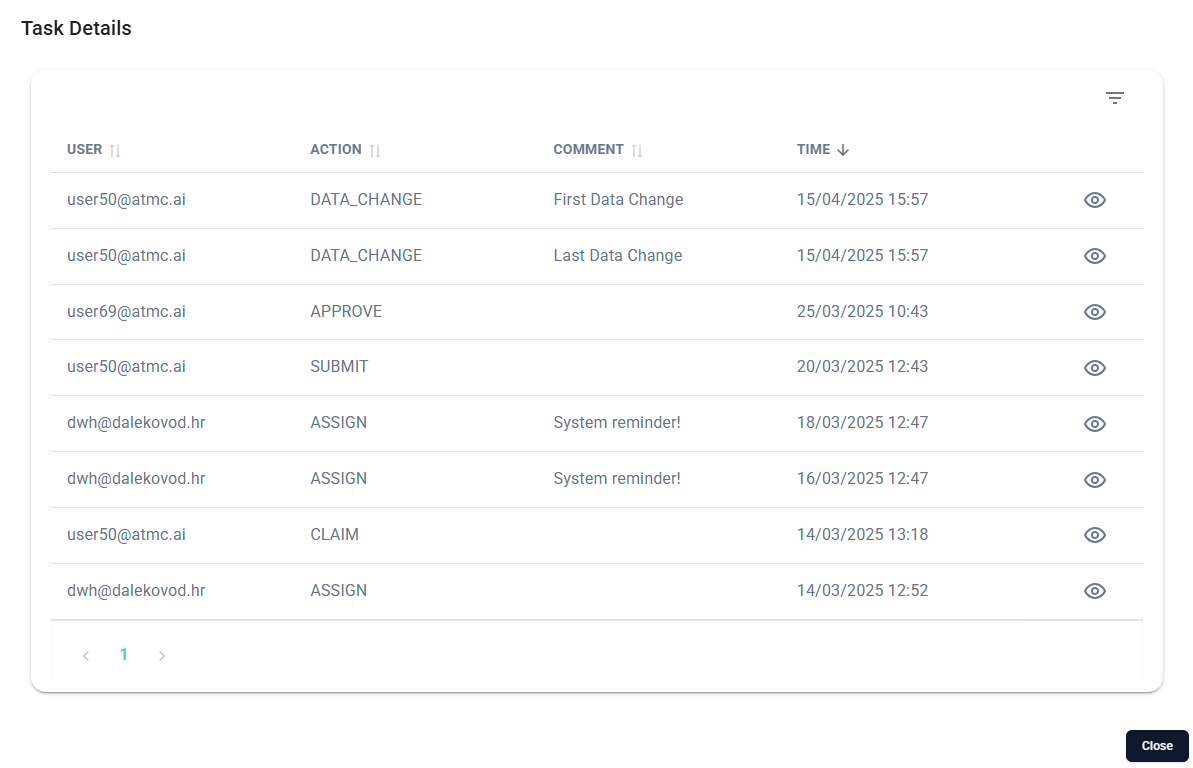
These actions may include:
- Claim
- Submit
- Approve
- Reject
- First Data Change
- …and other relevant events